| « Back |
“The year 2021 marks the beginning of the structural transformation of our core business in response to the shift in regulatory and macro environment. The progress has been encouraging, with continuous increase in lending priced within 24% and a record level of loan origination for the full year,” said
“We are pleased with our performance amid times of change,” said
Fourth Quarter and Full Year 2021 Operational Highlights:
- User base
- Total number of registered users reached 165 million as of
December 31, 2021 , representing an increase of 40.0% from 118 million as ofDecember 31, 2020 ; and users with credit line reached 36.9 million as ofDecember 31, 2021 , up by 32.9% from 27.7 million as ofDecember 31, 2020 . - Number of active users1 who used our loan products in the fourth quarter of 2021 was 6.3 million, representing a decrease of 23.8% from 8.2 million in the fourth quarter of 2020. Number of active users1 who used our loan products in 2021 reached 14.2 million, representing an increase of 9.6% from 12.9 million in 2020.
- Number of new active users who used our loan products in the fourth quarter of 2021 was 0.9 million, representing a decrease of 55.6% from 2.1 million in the fourth quarter of 2020. Number of new active users who used our loan products in 2021 was 5.9 million, representing a decrease of 3.8% from 6.1 million in 2020.
- Loan facilitation business
- Total loan originations2 in the fourth quarter of 2021 was
RMB43.6 billion , a decrease of 18.1% fromRMB53.2 billion in the fourth quarter of 2020. Total loan originations2 in 2021 reachedRMB214 billion , an increase of 21.0% fromRMB177 billion in 2020. - Total outstanding principal balance of loans2 reached
RMB85.9 billion as ofDecember 31, 2021 , representing an increase of 12.4% fromRMB76.5 billion as ofDecember 31, 2020 . - Lexin has continued to expand financing services for small and micro business owners. In the fourth quarter, loan originations for small and micro business owners reached
RMB3.9 billion , and in 2021, the number reachedRMB15.3 billion . - Number of orders placed on our platform in the fourth quarter of 2021 was 33.4 million, representing a decrease of 61.8% from 87.6 million in the fourth quarter of 2020. Number of orders placed on our platform in 2021 was 242 million, representing a decrease of 18.6% from 298 million in 2020.
- New consumption efforts
- In the fourth quarter of 2021, Maiya recorded GMV of
RMB477 million , and, in 2021, the number reachedRMB1.4 billion . - In the fourth quarter of 2021, Maiya has served over 601,000 users and 3,200 merchants. In 2021, Maiya has served over 1,699,800 users and 4,100 merchants, of which 93.9% were brick-and-mortar vendors.
- Credit performance
- 90 day+ delinquency ratio was 1.92% as of
December 31, 2021 . - First payment default rate (30 day+) for new loan originations was below 1% as of
December 31, 2021 . - Other operational highlights
- The GMV3 of our e-commerce channel in the fourth quarter of 2021 amounted to
RMB1.2 billion , representing a decrease of 10.7% fromRMB1.4 billion in the fourth quarter of 2020. The GMV3 of our e-commerce channel in 2021 wasRMB5.2 billion , remaining stable fromRMB5.3 billion in 2020. - The weighted average tenor of loans originated on our platform in the fourth quarter was approximately 10.3 months, representing a decrease from 12.0 months in the fourth quarter of 2020. The nominal APR4 was 12.4% for the fourth quarter of 2021, representing a decrease from 16.1% in the fourth quarter of 2020. In 2021, the weighted average tenor of loans originated was approximately 11.2 months, representing a slight decrease from 11.4 months in 2020. The nominal APR4 was 14.5% for 2021, representing a decrease from 14.9% for 2020.
1. Active users refer to, for a specified period, users who made at least one transaction during that period through our platform or through our third-party partners’ platforms using credit line granted by us.
2. Originations of loans and outstanding principal balance represent the origination and outstanding principal balance of both on- and off-balance sheet loans.
3. GMV refers to the total value of transactions completed for products purchased on the e-commerce channel, net of returns.
4. Nominal APR refers to all-in interest costs and fees to the borrower over the net proceeds received by the borrower as a percentage of the total loan originations of both on- and off-balance sheet loans.
Fourth Quarter 2021 Financial Highlights:
- Total operating revenue was
RMB2,199 million , representing a decrease of 27.5% from the fourth quarter of 2020. Credit-oriented services income wasRMB1,145 million , representing a decrease of 37.9% from the fourth quarter of 2020. Platform-based services income wasRMB538 million , representing a decrease of 25.0% from the fourth quarter of 2020. - Gross profit was
RMB1,212 million , representing a decrease of 20.3% from the fourth quarter of 2020. - Net income was
RMB256 million , representing a decrease of 49.8% from the fourth quarter of 2020. - Non-GAAP EBIT5 was
RMB364 million , representing a decrease of 48.3% from the fourth quarter of 2020. - Adjusted net income5 was
RMB315 million , representing a decrease of 47.7% from the fourth quarter of 2020. Adjusted net income per ADS5 wasRMB1.52 on a fully diluted basis.
Full Year 2021 Financial Highlights:
- Total operating revenue was
RMB11,381 million . Credit-oriented services income wasRMB6,956 million , representing a decrease of 7.6% from 2020. Platform-based services income reachedRMB2,569 million , representing an increase of 26.1% from 2020. - Gross profit reached
RMB5,749 million , representing an increase of 58.2% from 2020. - Net income was
RMB2,334 million , representing an increase of 292% from 2020. - Non-GAAP EBIT5 was
RMB3,025 million , representing an increase of 196% from 2020. - Adjusted net income5 was
RMB2,578 million , representing an increase of 186% from 2020. Adjusted net income per ADS5 wasRMB12.43 on a fully diluted basis, representing an increase of 183% from 2020.
5. Non-GAAP EBIT, adjusted net income, adjusted net income per ordinary share and per ADS are non-GAAP financial measures. For more information on non-GAAP financial measures, please see the section of “Use of Non-GAAP Financial Measures Statement” and the tables captioned “Unaudited Reconciliations of GAAP and Non-GAAP Results” set forth at the end of this press release.
Fourth Quarter 2021 Financial Results:
Operating revenue decreased from
Credit-oriented services income decreased by 37.9% from
Loan facilitation and servicing fees-credit oriented decreased by 41.4% from
Interest and financial services income and other revenues decreased by 22.3% from
Guarantee income decreased by 49.2% from
Platform-based services income decreased by 25.0% from
Loan facilitation and servicing fees-performance based decreased by 29.3% from
Processing and servicing cost increased by 22.7% from
Provision for credit losses of financing receivables was a reversal of
Provision for credit losses of contract assets and receivables decreased by 76.2% from
Provision for credit losses of contingent liabilities of guarantee decreased by 94.6%from
Gross profit decreased by 20.3% from
Sales and marketing expenses decreased by 4.5% from
Research and development expenses increased by 72.0% from
Change in fair value of financial guarantee derivatives and loans at fair value was a loss of
Income tax expense for the fourth quarter of 2021 was
Net income for the fourth quarter of 2021 was
Adjusted net income attributable to ordinary shareholders of the Company for the fourth quarter of 2021 was
Full Year 2021 Financial Results:
Operating revenue decreased 2.3% from
Online direct sales decreased by 12.6% from
Credit-oriented services income decreased by 7.6% from
Loan facilitation and servicing fees-credit oriented increased by 17.5% from
Interest and financial services income and other revenues increased by 22.1% from
Guarantee income decreased by 66.6% from
Platform-based services income increased by 26.1% from
Loan facilitation and servicing fees-performance based increased by 18.6% from
Loan facilitation and servicing fees-volume based increased by 164%from
Cost of sales decreased by 7.7% from
Funding cost decreased by 22.4% from
Processing and servicing cost increased by 31.5% from
Provision for credit losses of financing receivables decreased by 48.5% from
Provision for credit losses of contract assets and receivables increased by 20.2% from
Provision for credit losses of contingent liabilities of guarantee decrease by 78.4% from
Gross profit increased by 58.2% from
Sales and marketing expenses increased by 30.2% from
Research and development expenses increased by 15.8% from
Change in fair value of financial guarantee derivatives and loans at fair value was a loss of
Income tax expense for 2021 was
Net income for 2021 was
Adjusted net income attributable to ordinary shareholders of the Company for 2021 was
Conference Call
The Company’s management will host an earnings conference call at
Participants who wish to join the conference call should register online at:
http://apac.directeventreg.com/registration/event/4574305
Please note the Conference ID number of 4574305
Once registration is completed, participants will receive the dial-in information for the conference call, an event passcode, and a unique registrant ID number.
Participants joining the conference call should dial in at least 10 minutes before the scheduled start time.
Additionally, a live and archived webcast of the conference call will be available on the Company’s investor relations website at http://ir.lexin.com.
A replay of the conference call will be accessible approximately two hours after the conclusion of the live call until
| 1 855 452 5696 or 1 646 254 3697 | |
| International: | 61 2 8199 0299 |
| Replay Access Code: | 4574305 |
About
Lexin is a leading online consumption and finance platform in
For more information, please visit http://ir.lexin.com.
To follow us on Twitter, please go to: https://twitter.com/LexinFintech.
Use of Non-GAAP Financial Measures Statement
In evaluating our business, we consider and use adjusted net income attributable to ordinary shareholders of the Company, non-GAAP EBIT, adjusted net income per ordinary share and per ADS attributable to ordinary shareholders of the Company, four non-GAAP measures, as supplemental measures to review and assess our operating performance. The presentation of the non-GAAP financial measures is not intended to be considered in isolation or as a substitute for the financial information prepared and presented in accordance with
We present these non-GAAP financial measures because it is used by our management to evaluate our operating performance and formulate business plans. Adjusted net income attributable to ordinary shareholders of the Company enables our management to assess our operating results without considering the impact of share-based compensation expenses, interest expense associated with convertible notes, investment-related impairment, and investment (loss)/income. Non-GAAP EBIT, on the other hand, enables our management to assess our operating results without considering the impact of income tax expense/(benefit), share-based compensation expenses, interest expense, net, investment-related impairment, and investment (loss)/income. We also believe that the use of these non-GAAP financial measures facilitates investors’ assessment of our operating performance. These non-GAAP financial measures are not defined under
These non-GAAP financial measures have limitations as an analytical tool. One of the key limitations of using adjusted net income attributable to ordinary shareholders of the Company and non-GAAP EBIT is that they do not reflect all items of income and expense that affect our operations. Share-based compensation expenses, interest expense associated with convertible notes, income tax expense/(benefit), interest expense, net, investment-related impairment, and investment (loss)/income have been and may continue to be incurred in our business and are not reflected in the presentation of adjusted net income attributable to ordinary shareholders of the Company and non-GAAP EBIT. Further, these non-GAAP financial measures may differ from the non-GAAP financial information used by other companies, including peer companies, and therefore their comparability may be limited.
We compensate for these limitations by reconciling the non-GAAP financial measure to the most directly comparable
Exchange Rate Information Statement
This announcement contains translations of certain RMB amounts into
Safe Harbor Statement
This announcement contains forward-looking statements. These statements are made under the “safe harbor” provisions of the
For investor and media inquiries, please contact:
IR inquiries:
Tel: +86 (755) 3637-8888 ext. 6258
E-mail: patriciacheng@lexin.com
Media inquiries:
Tel: +86 (755) 3637-8888 ext. 6993
E-mail: liminchen@lexin.com
SOURCE
Unaudited Condensed Consolidated Balance Sheets
| As of | |||||||||
| (In thousands) | |||||||||
| RMB | RMB | US$ | |||||||
| ASSETS | |||||||||
| Current assets | |||||||||
| Cash and cash equivalents | 1,563,755 | 2,664,132 | 418,060 | ||||||
| Restricted cash | 1,112,152 | 1,305,435 | 204,851 | ||||||
| Restricted time deposits | 1,779,458 | 1,745,898 | 273,969 | ||||||
| Short-term financing receivables, net of allowance for credit losses of |
4,918,548 | 3,772,975 | 592,062 | ||||||
| Loans at fair value | 381,393 | 252,970 | 39,697 | ||||||
| Accrued interest receivable, net of allowance for credit losses of nil |
79,793 | 53,513 | 8,397 | ||||||
| Prepaid expenses and other current assets | 1,004,845 | 941,150 | 147,687 | ||||||
| Amounts due from related parties | 941 | 6,337 | 994 | ||||||
| Deposits to insurance companies and guarantee companies | 1,066,281 | 1,378,489 | 216,315 | ||||||
| Short-term guarantee receivables, net of allowance for credit losses of |
756,197 | 543,949 | 85,357 | ||||||
| Short-term contract assets and service fees receivable, net of allowance for credit losses of |
3,707,649 | 3,942,700 | 618,696 | ||||||
| Inventories, net | 47,170 | 47,816 | 7,503 | ||||||
| Total current assets | 16,418,182 | 16,655,364 | 2,613,588 | ||||||
| Non‑current assets | |||||||||
| Restricted cash | 163,999 | 149,247 | 23,420 | ||||||
| Long‑term financing receivables, net of allowance for credit losses of |
204,761 | 241,127 | 37,838 | ||||||
| Long-term guarantee receivables, net of allowance for credit losses of |
218,654 | 101,562 | 15,937 | ||||||
| Long-term contract assets and service fees receivable, net of allowance for credit losses of |
481,989 | 244,672 | 38,394 | ||||||
| Property, equipment and software, net | 125,694 | 195,330 | 30,652 | ||||||
| Land use rights, net | 1,000,467 | 966,067 | 151,597 | ||||||
| Long‑term investments | 521,802 | 469,064 | 73,606 | ||||||
| Deferred tax assets | 747,332 | 1,176,878 | 184,678 | ||||||
| Other assets | 462,285 | 826,883 | 129,756 | ||||||
| Total non‑current assets | 3,926,983 | 4,370,830 | 685,878 | ||||||
| TOTAL ASSETS | 20,345,165 | 21,026,194 | 3,299,466 | ||||||
| LIABILITIES | |||||||||
| Current liabilities | |||||||||
| Accounts payable | 42,961 | 15,705 | 2,464 | ||||||
| Amounts due to related parties | 67,514 | 23,102 | 3,625 | ||||||
| Short‑term borrowings | 1,827,063 | 1,799,741 | 282,419 | ||||||
| Short‑term funding debts | 4,685,935 | 3,101,381 | 486,674 | ||||||
| Accrued interest payable | 36,484 | 24,851 | 3,900 | ||||||
| Deferred guarantee income | 694,582 | 419,843 | 65,883 | ||||||
| Contingent guarantee liabilities | 1,738,787 | 928,840 | 145,755 | ||||||
| Accrued expenses and other current liabilities | 2,926,347 | 3,873,657 | 607,861 | ||||||
| Total current liabilities | 12,019,673 | 10,187,120 | 1,598,581 | ||||||
| Non‑current liabilities | |||||||||
| Long‑term funding debts | 825,814 | 696,852 | 109,351 | ||||||
| Deferred tax liabilities | 21,046 | 54,335 | 8,526 | ||||||
| Convertible notes | 1,920,227 | 1,882,689 | 295,435 | ||||||
| Other long-term liabilities | 27,667 | 137,389 | 21,559 | ||||||
| Total non‑current liabilities | 2,794,754 | 2,771,265 | 434,871 | ||||||
| TOTAL LIABILITIES | 14,814,427 | 12,958,385 | 2,033,452 | ||||||
| SHAREHOLDERS’ EQUITY: | |||||||||
| Class A Ordinary Shares | 176 | 180 | 28 | ||||||
| Class B Ordinary Shares | 58 | 57 | 9 | ||||||
| Additional paid‑in capital | 2,724,006 | 2,918,993 | 458,054 | ||||||
| Statutory reserves | 649,234 | 901,322 | 141,437 | ||||||
| Accumulated other comprehensive income | 3,308 | 11,273 | 1,769 | ||||||
| Retained earnings | 2,113,956 | 4,195,791 | 658,411 | ||||||
| Non-controlling interests | 40,000 | 40,193 | 6,306 | ||||||
| TOTAL SHAREHOLDERS’ EQUITY | 5,530,738 | 8,067,809 | 1,266,014 | ||||||
| TOTAL LIABILITIES AND SHAREHOLDERS’ EQUITY | 20,345,165 | 21,026,194 | 3,299,466 | ||||||
Unaudited Condensed Consolidated Statements of Operations
| For the Three Months Ended |
For the Year Ended |
||||||||||||||||||
| (In thousands, except for share and per share data) | 2020 | 2021 | 2020 | 2021 | |||||||||||||||
| RMB | RMB | US$ | RMB | RMB | US$ | ||||||||||||||
| Operating revenue: | |||||||||||||||||||
| Online direct sales | 427,760 | 425,765 | 66,812 | 1,900,835 | 1,661,156 | 260,672 | |||||||||||||
| Membership services | 37,009 | 68,189 | 10,700 | 113,107 | 107,901 | 16,932 | |||||||||||||
| Other services | 5,482 | 21,564 | 3,383 | 68,890 | 86,304 | 13,543 | |||||||||||||
| Online direct sales and services income | 470,251 | 515,518 | 80,895 | 2,082,832 | 1,855,361 | 291,147 | |||||||||||||
| Loan facilitation and servicing fees-credit oriented | 1,034,265 | 606,029 | 95,099 | 3,786,996 | 4,448,344 | 698,042 | |||||||||||||
| Interest and financial services income and other revenues | 472,668 | 367,430 | 57,658 | 1,418,892 | 1,732,922 | 271,933 | |||||||||||||
| Guarantee income | 338,580 | 171,848 | 26,967 | 2,319,693 | 774,544 | 121,543 | |||||||||||||
| Credit-oriented services income | 1,845,513 | 1,145,307 | 179,724 | 7,525,581 | 6,955,810 | 1,091,518 | |||||||||||||
| Loan facilitation and servicing fees-performance based | 679,494 | 480,648 | 75,424 | 1,930,835 | 2,289,452 | 359,265 | |||||||||||||
| Loan facilitation and servicing fees-volume based | 37,903 | 57,738 | 9,060 | 106,007 | 279,902 | 43,923 | |||||||||||||
| Platform-based services income | 717,397 | 538,386 | 84,484 | 2,036,842 | 2,569,354 | 403,188 | |||||||||||||
| Total operating revenue | 3,033,161 | 2,199,211 | 345,103 | 11,645,255 | 11,380,525 | 1,785,853 | |||||||||||||
| Operating cost: | |||||||||||||||||||
| Cost of sales | (431,804 | ) | (462,523 | ) | (72,580 | ) | (1,907,508 | ) | (1,759,956 | ) | (276,176 | ) | |||||||
| Funding cost | (140,735 | ) | (98,222 | ) | (15,413 | ) | (589,837 | ) | (457,615 | ) | (71,810 | ) | |||||||
| Processing and servicing cost | (381,964 | ) | (468,657 | ) | (73,543 | ) | (1,413,212 | ) | (1,858,901 | ) | (291,702 | ) | |||||||
| Provision for credit losses of financing receivables | (150,851 | ) | 98,873 | 15,515 | (779,235 | ) | (401,104 | ) | (62,942 | ) | |||||||||
| Provision for credit losses of contract assets and receivables | (187,227 | ) | (44,644 | ) | (7,006 | ) | (441,805 | ) | (531,237 | ) | (83,363 | ) | |||||||
| Provision for credit losses of contingent liabilities of guarantee | (220,489 | ) | (11,780 | ) | (1,849 | ) | (2,880,590 | ) | (622,438 | ) | (97,674 | ) | |||||||
| Total operating cost | (1,513,070 | ) | (986,953 | ) | (154,876 | ) | (8,012,187 | ) | (5,631,251 | ) | (883,667 | ) | |||||||
| Gross profit | 1,520,091 | 1,212,258 | 190,227 | 3,633,068 | 5,749,274 | 902,186 | |||||||||||||
| Operating expenses: | |||||||||||||||||||
| Sales and marketing expenses | (343,272 | ) | (327,652 | ) | (51,416 | ) | (1,274,402 | ) | (1,658,904 | ) | (260,318 | ) | |||||||
| Research and development expenses | (95,124 | ) | (163,636 | ) | (25,678 | ) | (474,265 | ) | (549,286 | ) | (86,195 | ) | |||||||
| General and administrative expenses | (125,464 | ) | (118,248 | ) | (18,556 | ) | (451,284 | ) | (470,661 | ) | (73,857 | ) | |||||||
| Total operating expenses | (563,860 | ) | (609,536 | ) | (95,650 | ) | (2,199,951 | ) | (2,678,851 | ) | (420,370 | ) | |||||||
| Change in fair value of financial guarantee derivatives and loans at fair value, net | (361,774 | ) | (340,728 | ) | (53,468 | ) | (754,724 | ) | (347,084 | ) | (54,465 | ) | |||||||
| Interest expense, net | (18,074 | ) | (12,752 | ) | (2,001 | ) | (77,542 | ) | (63,125 | ) | (9,906 | ) | |||||||
| Investment-related impairment | (33,786 | ) | - | - | (69,156 | ) | - | - | |||||||||||
| Investment (loss)/ income | (1,436 | ) | (107 | ) | (17 | ) | 7,885 | (4,160 | ) | (653 | ) | ||||||||
| Others, net | 62,734 | 53,591 | 8,410 | 146,029 | 113,480 | 17,807 | |||||||||||||
| Income before income tax expense | 603,895 | 302,726 | 47,501 | 685,609 | 2,769,534 | 434,599 | |||||||||||||
| Income tax expense | (94,219 | ) | (47,115 | ) | (7,393 | ) | (90,629 | ) | (435,418 | ) | (68,327 | ) | |||||||
| Net income | 509,676 | 255,611 | 40,108 | 594,980 | 2,334,116 | 366,272 | |||||||||||||
| Less: Net income attributable to non-controlling interests | - | (423 | ) | (66 | ) | - | 193 | 30 | |||||||||||
| Net income attributable to ordinary shareholders of the Company | 509,676 | 256,034 | 40,174 | 594,980 | 2,333,923 | 366,242 | |||||||||||||
| Net income per ordinary share attributable to ordinary shareholders of the Company | |||||||||||||||||||
| Basic | 1.39 | 0.69 | 0.11 | 1.63 | 6.33 | 0.99 | |||||||||||||
| Diluted | 1.27 | 0.65 | 0.10 | 1.56 | 5.73 | 0.90 | |||||||||||||
| Net income per ADS attributable to ordinary shareholders of the Company | |||||||||||||||||||
| Basic | 2.79 | 1.39 | 0.22 | 3.26 | 12.67 | 1.99 | |||||||||||||
| Diluted | 2.54 | 1.29 | 0.20 | 3.13 | 11.46 | 1.80 | |||||||||||||
| Weighted average ordinary shares outstanding | |||||||||||||||||||
| Basic | 365,939,185 | 369,328,311 | 369,328,311 | 364,733,164 | 368,460,867 | 368,460,867 | |||||||||||||
| Diluted | 411,086,216 | 414,080,634 | 414,080,634 | 411,229,810 | 414,992,716 | 414,992,716 | |||||||||||||
Unaudited Condensed Consolidated Statements of Comprehensive Income
| For the Three Months Ended |
For the Year Ended |
||||||||||||||||||
| (In thousands) | 2020 | 2021 | 2020 | 2021 | |||||||||||||||
| RMB | RMB | US$ | RMB | RMB | US$ | ||||||||||||||
| Net income | 509,676 | 255,611 | 40,108 | 594,980 | 2,334,116 | 366,272 | |||||||||||||
| Other comprehensive income/(loss) | |||||||||||||||||||
| Foreign currency translation adjustment, net of nil tax | 13,884 | 5,668 | 889 | 10,596 | 7,965 | 1,250 | |||||||||||||
| Total comprehensive income | 523,560 | 261,279 | 40,997 | 605,576 | 2,342,081 | 367,522 | |||||||||||||
| Less: Net income attributable to non-controlling interests | - | (423 | ) | (66 | ) | - | 193 | 30 | |||||||||||
| Total comprehensive income attributable to ordinary shareholders of the Company | 523,560 | 261,702 | 41,063 | 605,576 | 2,341,888 | 367,492 | |||||||||||||
Unaudited Reconciliations of GAAP and Non-GAAP Results
| For the Three Months Ended |
For the Year Ended |
||||||||||||||||||
| (In thousands, except for share and per share data) | 2020 | 2021 | 2020 | 2021 | |||||||||||||||
| RMB | RMB | US$ | RMB | RMB | US$ | ||||||||||||||
| Reconciliation of Adjusted net income attributable to ordinary shareholders of the Company to Net income attributable to ordinary shareholders of the Company | |||||||||||||||||||
| Net income attributable to ordinary shareholders of the Company | 509,676 | 256,034 | 40,174 | 594,980 | 2,333,923 | 366,242 | |||||||||||||
| Add: Share-based compensation expenses | 46,633 | 48,039 | 7,537 | 198,825 | 187,884 | 29,483 | |||||||||||||
| Interest expense associated with convertible notes | 11,535 | 11,190 | 1,756 | 47,781 | 44,865 | 7,040 | |||||||||||||
| Investment-related impairment | 33,786 | - | - | 69,156 | - | - | |||||||||||||
| Investment loss/(income) | 1,436 | 107 | 17 | (7,885 | ) | 4,160 | 653 | ||||||||||||
| Tax effects on Non-GAAP adjustments(1) | - | - | - | - | 7,151 | 1,122 | |||||||||||||
| Adjusted net income attributable to ordinary shareholders of the Company | 603,066 | 315,370 | 49,484 | 902,857 | 2,577,983 | 404,540 | |||||||||||||
| Adjusted net income per ordinary share attributable to ordinary shareholders of the Company | |||||||||||||||||||
| Basic | 1.65 | 0.85 | 0.13 | 2.48 | 7.00 | 1.10 | |||||||||||||
| Diluted | 1.47 | 0.76 | 0.12 | 2.20 | 6.21 | 0.97 | |||||||||||||
| Adjusted net income per ADS attributable to ordinary shareholders of the Company | |||||||||||||||||||
| Basic | 3.30 | 1.71 | 0.27 | 4.95 | 13.99 | 2.20 | |||||||||||||
| Diluted | 2.93 | 1.52 | 0.24 | 4.39 | 12.43 | 1.95 | |||||||||||||
| Weighted average number of ordinary shares outstanding attributable to ordinary shareholders of the Company | |||||||||||||||||||
| Basic | 365,939,185 | 369,328,311 | 369,328,311 | 364,733,164 | 368,460,867 | 368,460,867 | |||||||||||||
| Diluted | 411,086,216 | 414,080,634 | 414,080,634 | 411,229,810 | 414,992,716 | 414,992,716 | |||||||||||||
(1) To exclude the tax effects related to the investment loss/(income).
Unaudited Reconciliations of GAAP and Non-GAAP Results
| For the Three Months Ended |
For the Year Ended |
||||||||||||||||||
| (In thousands) | 2020 | 2021 | 2020 | 2021 | |||||||||||||||
| RMB | RMB | US$ | RMB | RMB | US$ | ||||||||||||||
| Reconciliations of Non-GAAP EBIT to Net Income | |||||||||||||||||||
| Net income | 509,676 | 255,611 | 40,108 | 594,980 | 2,334,116 | 366,272 | |||||||||||||
| Add: Income tax expense | 94,219 | 47,115 | 7,393 | 90,629 | 435,418 | 68,327 | |||||||||||||
| Share-based compensation expenses | 46,633 | 48,039 | 7,537 | 198,825 | 187,884 | 29,483 | |||||||||||||
| Interest expense, net | 18,074 | 12,752 | 2,001 | 77,542 | 63,125 | 9,906 | |||||||||||||
| Investment-related impairment | 33,786 | - | - | 69,156 | - | - | |||||||||||||
| Investment loss/(income) | 1,436 | 107 | 17 | (7,885 | ) | 4,160 | 653 | ||||||||||||
| Non-GAAP EBIT | 703,824 | 363,624 | 57,056 | 1,023,247 | 3,024,703 | 474,641 | |||||||||||||
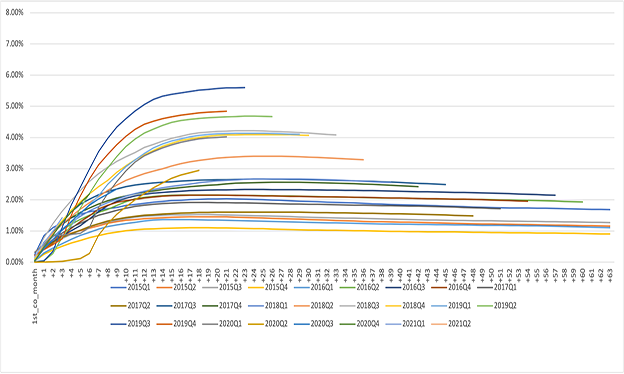
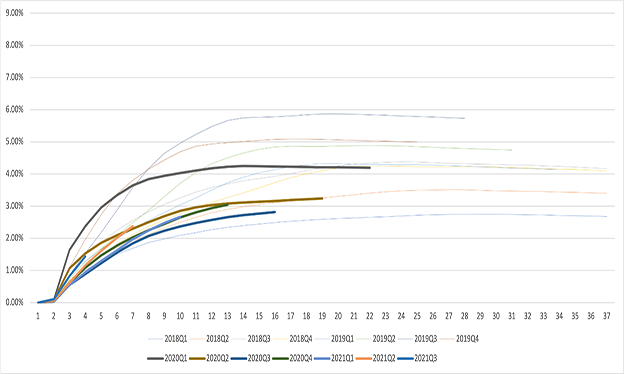
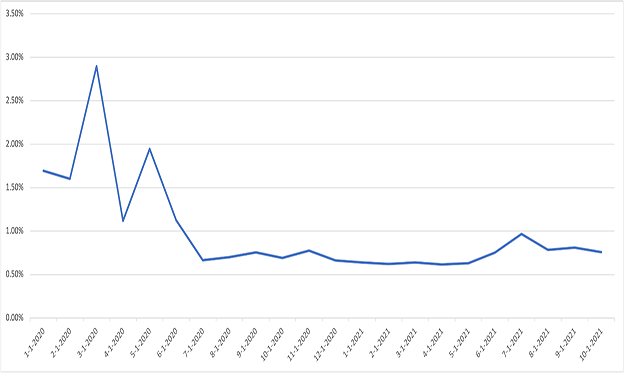
Additional Credit Information
Vintage Charge Off Curve
Dpd30+/GMV by Performance Windows
First Payment Default 30+

![]()
Source: LexinFintech Holdings Ltd.