
| « Back |
 View printer-friendly version View printer-friendly version |
 |
Mr.
In late June, risk events involving certain industry peers led to a sector-wide tightening of funding supply, impacting broader market sentiment and loan volume. In response, we have taken a disciplined approach to fortify our position: carefully managing our cost structure to enhance operational resilience, refining our risk parameters to safeguard asset quality, optimizing liquidity management for capital efficiency, and advancing our business diversification.
While near-term market uncertainty may persist for some time, our diversified business ecosystem provides a foundation for long-term sustainable operations and tech-empowerment transformation. We remain confident in the long-term fundamentals of our business.
Looking ahead, given the ongoing industry uncertainties, the Board has made a prudent decision to adjust our dividend policy to an annual evaluation cycle to preserve liquidity and maintain a financial buffer to support our business transformation. When market conditions stabilize and our operational performance recovers, the Board will actively evaluate options, including potential share repurchases, to enhance shareholder returns,"
Mr.
The recent risk events involving certain industry players have sector-wide effects, and we have been correspondingly impacted by these headwinds. While we are taking proactive measures to mitigate these uncertainties, our near-term performance will foreseeably remain under considerable pressure. As we manage through this industry transition, we remain highly disciplined, scaling back volume to prioritize asset quality. Our immediate focus is to safeguard our liquidity, fortify our balance sheet, and position the Company to resume sustainable growth once market conditions normalize."
Second Quarter Operational Highlights:
User Base
- Total number of registered users across our platform reached 253 million as of
June 30, 2026 , representing an increase of 7.2% from 236 million as ofJune 30, 2025 . - Number of active users1 in the second quarter of 2026 was 5.0 million, representing an increase of 6.1% from 4.7 million in the second quarter of 2025.
- Number of cumulative borrowers with successful drawdown was 39.2 million as of
June 30, 2026 , an increase of 11.4% from 35.2 million as ofJune 30, 2025 .
Loan Facilitation Business
- As of
June 30, 2026 , we cumulatively originatedRMB1,644 billion in loans, an increase of 15.0% fromRMB1,430 billion as ofJune 30, 2025 .
- Total loan originations2 in the second quarter of 2026 was
RMB55.4 billion , an increase of 4.8% fromRMB52.9 billion in the second quarter of 2025. - Total outstanding principal balance of loans3 was
RMB93.7 billion as ofJune 30, 2026 , representing a decrease of 11.4% fromRMB106 billion as ofJune 30, 2025 .
Credit Performance4
- 90 day+ delinquency ratio5 was 3.6% as of
June 30, 2026 , as compared with 3.5% as ofMarch 31, 2026 . - First payment default rate (30 day+) for new loan originations was below 1% as of
June 30, 2026 .
Installment E-commerce Platform Service
- GMV6 in the second quarter of 2026 for our installment e-commerce platform service was
RMB2,342 million , representing an increase of 15.5% fromRMB2,029 million in the second quarter of 2025. - In the second quarter of 2026, our installment e-commerce platform service served over 700,000 users.
Other Operational Highlights
- The weighted average tenor of loans originated in the second quarter of 2026 was approximately 10.7 months, as compared with 13.2 months in the second quarter of 2025.
- Repeated borrowers’ contribution7 of loans across our platform for the second quarter of 2026 was 85.7%.
Second Quarter 2026 Financial Highlights:
- Total operating revenue was
RMB3,187 million , representing a decrease of 11.2% from the second quarter of 2025. - Credit facilitation service income was
RMB1,930 million , representing a decrease of 15.0% from the second quarter of 2025. Tech-empowerment service income wasRMB473 million , representing a decrease of 43.0% from the second quarter of 2025. Installment e-commerce platform service income wasRMB784 million , representing an increase of 60.8% from the second quarter of 2025. - Net income attributable to ordinary shareholders of the Company was
RMB101 million , representing a decrease of 80.2% from the second quarter of 2025. Net income per ADS attributable to ordinary shareholders of the Company wasRMB0.61 on a fully diluted basis. - Adjusted net income attributable to ordinary shareholders of the Company8 was
RMB127 million , representing a decrease of 76.4% from the second quarter of 2025. Adjusted net income per ADS attributable to ordinary shareholders of the Company8 wasRMB0.76 on a fully diluted basis.
__________________________
- Active users refer to, for a specified period, users who made at least one transaction during that period through our platform or through our third-party partners’ platforms using the credit line granted by us.
- Total loan originations refer to the total principal amount of loans originated during the given period through our platform or through our third-party partners' platforms.
- Total outstanding principal balance of loans refers to the total amount of principal outstanding for loans facilitated and originated at the end of each period, including loans guaranteed by our financial guarantee companies and the loans facilitated across third party platforms that we bear principal risk and excluding loans delinquent for more than 180 days that are charged-off.
- Loans under Intelligent Credit Platform are excluded from the calculation of credit performance. Intelligent Credit Platform (ICP) is an intelligent platform on our “Fenqile” app, under which we match borrowers and financial institutions through big data and cloud computing technology. For loans facilitated through ICP, the Company does not bear principal risk.
- “90 day+ delinquency rate” refers to the outstanding principal balance of on- and off-balance sheet loans that were 91 to 180 calendar days past due as a percentage of the total outstanding principal balance of on- and off-balance sheet loans across our platform and those loans across third party platforms that we bear principle risk as of a specific date. Loans that are charged-off and loans under “ICP”, E-commerce business and overseas are not included in the delinquency rate calculation.
- GMV refers to the total value of transactions completed for products purchased on our e-commerce and Maiya channel, net of returns.
- Repeated borrowers’ contribution for a given period refers to the principal amount of loans borrowed during that period by borrowers who had previously made at least one successful drawdown as a percentage of the total loan facilitation and origination volume through our platform during that period.
- Adjusted net income attributable to ordinary shareholders of the Company, adjusted net income per ordinary share and per ADS attributable to ordinary shareholders of the Company are non-GAAP financial measures. For more information on non-GAAP financial measures, please see the section of “Use of Non-GAAP Financial Measures Statement” and the tables captioned “Unaudited Reconciliations of GAAP and Non-GAAP Results” set forth at the end of this press release.
Second Quarter 2026 Financial Results:
Operating revenue was
Credit facilitation service income was
Loan facilitation and servicing fees-credit oriented was
Guarantee income was
Financing income was
Tech-empowerment service income was
Installment e-commerce platform service income was
Cost of sales consisted of cost of inventory sold and other costs. Cost of sales was
Funding cost was
Processing and servicing costs was
Provision for financing receivables was
Provision for contract assets and receivables was
Provision for contingent guarantee liabilities was
Gross profit was
Sales and marketing expenses was
Research and development expenses was
General and administrative expenses was
Change in fair value of financial guarantee derivatives and loans at fair value was a gain of
Income tax expense was
Net income was
Update of Share Repurchase Program
Pursuant to the Company’s share repurchase program of up to
Updated Dividend Policy
On
Business Outlook
Looking ahead, given the ongoing industry and regulatory uncertainties, we anticipate total loan origination for the third quarter of 2026 to decrease significantly on a quarter-over-quarter basis and we may incur a net loss for the quarter.
This forecast reflects our current preliminary views, which are subject to the impact of macroeconomic factors. The Company may adjust its performance outlook as appropriate based on evolving circumstances.
Conference Call
The Company’s management will host an earnings conference call at
Participants who wish to join the conference call should register online at:
https://register-conf.media-server.com/register/BI1de4908791bd49b8b7d1448ef38c027a
Once registration is completed, each participant will receive the dial-in number and a unique access PIN for the conference call.
Participants joining the conference call should dial in at least 10 minutes before the scheduled start time.
A live and archived webcast of the conference call will also be available at the Company's investor relations website at http://ir.lexin.com.
About LexinFintech Holdings Ltd.
We are a leading credit technology-empowered personal financial service enabler. Our mission is to use technology and risk management expertise to make financing more accessible for young generation consumers. We strive to achieve this mission by connecting consumers with financial institutions, where we facilitate through a unique model that includes online and offline channels, installment consumption platform, big data and AI driven credit risk management capabilities, as well as smart user and loan management systems. We also empower financial institutions by providing cutting-edge proprietary technology solutions to meet their needs of financial digital transformation.
For more information, please visit http://ir.lexin.com.
To follow us on Twitter, please go to: https://twitter.com/LexinFintech.
Use of Non-GAAP Financial Measures Statement
In evaluating our business, we consider and use adjusted net income attributable to ordinary shareholders of the Company, non-GAAP EBIT, adjusted net income per ordinary share and per ADS attributable to ordinary shareholders of the Company, four non-GAAP measures, as supplemental measures to review and assess our operating performance. The presentation of the non-GAAP financial measures is not intended to be considered in isolation or as a substitute for the financial information prepared and presented in accordance with U.S. GAAP. We define adjusted net income attributable to ordinary shareholders of the Company as net income attributable to ordinary shareholders of the Company excluding share-based compensation expenses, interest expense associated with convertible notes, and investment income/(loss) and we define non-GAAP EBIT as net income excluding income tax expense, share-based compensation expenses, interest expense, net, and investment income/(loss).
We present these non-GAAP financial measures because they are used by our management to evaluate our operating performance and formulate business plans. Adjusted net income attributable to ordinary shareholders of the Company enables our management to assess our operating results without considering the impact of share-based compensation expenses, interest expense associated with convertible notes, and investment income/(loss). Non-GAAP EBIT, on the other hand, enables our management to assess our operating results without considering the impact of income tax expense, share-based compensation expenses, interest expense, net, and investment income/(loss). We also believe that the use of these non-GAAP financial measures facilitates investors’ assessment of our operating performance. These non-GAAP financial measures are not defined under U.S. GAAP and are not presented in accordance with U.S. GAAP.
These non-GAAP financial measures have limitations as an analytical tool. One of the key limitations of using adjusted net income attributable to ordinary shareholders of the Company and non-GAAP EBIT is that they do not reflect all items of income and expense that affect our operations. Share-based compensation expenses, interest expense associated with convertible notes, income tax expense, interest expense, net, and investment income/(loss) have been and may continue to be incurred in our business and are not reflected in the presentation of adjusted net income attributable to ordinary shareholders of the Company and non-GAAP EBIT. Further, these non-GAAP financial measures may differ from the non-GAAP financial information used by other companies, including peer companies, and therefore their comparability may be limited.
We compensate for these limitations by reconciling each of the non-GAAP financial measures to the most directly comparable U.S. GAAP financial measure, which should be considered when evaluating our performance. We encourage you to review our financial information in its entirety and not rely on a single financial measure.
Exchange Rate Information Statement
This announcement contains translations of certain RMB amounts into U.S. dollars (“US$”) at specified rates solely for the convenience of the reader. Unless otherwise stated, all translations from RMB to US$ were made at the rate of RMB6.7851 to US$1.00, the exchange rate set forth in the H.10 statistical release of the Federal Reserve Board on June 30, 2026. The Company makes no representation that the RMB or US$ amounts referred could be converted into US$ or RMB, as the case may be, at any particular rate or at all.
Safe Harbor Statement
This announcement contains forward-looking statements. These statements are made under the “safe harbor” provisions of the U.S. Private Securities Litigation Reform Act of 1995. Statements that are not historical facts, including statements about Lexin’s beliefs and expectations, are forward-looking statements. These forward-looking statements can be identified by terminology such as “will,” “expects,” “anticipates,” “future,” “intends,” “plans,” “believes,” “estimates,” “confident” and similar statements. Among other things, the expectation of the collection efficiency and delinquency, business outlook and quotations from management in this announcement, contain forward-looking statements. Lexin may also make written or oral forward-looking statements in its periodic reports to the U.S. Securities and Exchange Commission (the “SEC”), in its annual report to shareholders, in press releases and other written materials and in oral statements made by its officers, directors or employees to third parties. Forward-looking statements involve inherent risks and uncertainties. A number of factors could cause actual results to differ materially from those contained in any forward-looking statement, including but not limited to the following: Lexin’s goal and strategies; Lexin’s expansion plans; Lexin’s future business development, financial condition and results of operations; Lexin’s expectation regarding demand for, and market acceptance of, its credit and investment management products; Lexin’s expectations regarding keeping and strengthening its relationship with borrowers, institutional funding partners, merchandise suppliers and other parties it collaborates with; general economic and business conditions; and assumptions underlying or related to any of the foregoing. Further information regarding these and other risks is included in Lexin’s filings with the SEC. All information provided in this press release and in the attachments is as of the date of this press release, and Lexin does not undertake any obligation to update any forward-looking statement, except as required under applicable law.
For investor and media inquiries, please contact:
LexinFintech Holdings Ltd.
IR inquiries:
Will Tan
Tel: +86 (755) 3637-8888 ext. 6258
E-mail: willtan@lexin.com
Media inquiries:
Ruifeng Xu
Tel: +86 (755) 3637-8888 ext. 6993
E-mail: media@lexin.com
SOURCE LexinFintech Holdings Ltd.
Unaudited Condensed Consolidated Balance Sheets |
|||||||||
| As of | |||||||||
| (In thousands) | |||||||||
| RMB | RMB | US$ | |||||||
| ASSETS | |||||||||
| Current Assets | |||||||||
| Cash and cash equivalents | 2,156,133 | 1,232,362 | 181,628 | ||||||
| Restricted cash | 1,717,773 | 1,164,978 | 171,697 | ||||||
| Restricted term deposit and short-term investments | 78,458 | 51,671 | 7,615 | ||||||
| Short-term financing receivables, net(1) | 5,450,418 | 4,749,246 | 699,952 | ||||||
| Short-term contract assets and receivables, net(1) | 3,763,096 | 3,699,274 | 545,206 | ||||||
| Deposits to insurance companies and guarantee companies | 2,187,609 | 2,234,221 | 329,283 | ||||||
| Prepayments and other current assets | 2,858,054 | 4,323,650 | 637,227 | ||||||
| Amounts due from related parties | 84,531 | 132,320 | 19,502 | ||||||
| Inventories, net | 24,119 | 26,321 | 3,879 | ||||||
| Total Current Assets | 18,320,191 | 17,614,043 | 2,595,989 | ||||||
| Non-current Assets | |||||||||
| Restricted cash | 91,937 | 82,831 | 12,208 | ||||||
| Long-term financing receivables, net(1) | 167,378 | 108,331 | 15,966 | ||||||
| Long-term contract assets and receivables, net(1) | 317,496 | 215,181 | 31,714 | ||||||
| Property, equipment and software, net | 895,046 | 1,018,803 | 150,153 | ||||||
| Land use rights, net | 828,467 | 811,267 | 119,566 | ||||||
| Long-term investments | 243,971 | 243,960 | 35,955 | ||||||
| Deferred tax assets | 1,763,235 | 1,857,317 | 273,735 | ||||||
| Other assets | 535,242 | 430,349 | 63,426 | ||||||
| Total Non-current Assets | 4,842,772 | 4,768,039 | 702,723 | ||||||
| TOTAL ASSETS | 23,162,963 | 22,382,082 | 3,298,712 | ||||||
| LIABILITIES | |||||||||
| Current liabilities | |||||||||
| Accounts payable | 101,178 | 148,155 | 21,835 | ||||||
| Amounts due to related parties | 8,708 | 9,172 | 1,352 | ||||||
| Short-term borrowings and current portion of long-term borrowings | 905,791 | 839,501 | 123,727 | ||||||
| Short-term funding debts | 2,440,685 | 998,347 | 147,138 | ||||||
| Deferred guarantee income | 1,305,911 | 1,558,203 | 229,651 | ||||||
| Contingent guarantee liabilities | 544,191 | 571,066 | 84,165 | ||||||
| Accruals and other current liabilities | 4,371,484 | 4,314,904 | 635,938 | ||||||
| Total Current Liabilities | 9,677,948 | 8,439,348 | 1,243,806 | ||||||
| Non-current Liabilities | |||||||||
| Long-term borrowings | 566,015 | 639,695 | 94,279 | ||||||
| Long-term funding debts | 850,590 | 1,209,872 | 178,313 | ||||||
| Deferred tax liabilities | 105,212 | 81,401 | 11,997 | ||||||
| Other long-term liabilities | 10,567 | 10,550 | 1,555 | ||||||
| Total Non-current Liabilities | 1,532,384 | 1,941,518 | 286,144 | ||||||
| TOTAL LIABILITIES | 11,210,332 | 10,380,866 | 1,529,950 | ||||||
| Shareholders’ equity: | |||||||||
| Class A Ordinary Shares | 209 | 184 | 28 | ||||||
| Class B Ordinary Shares | 41 | 41 | 7 | ||||||
| (493,846 | ) | (269,850 | ) | (39,771 | ) | ||||
| Additional paid-in capital | 3,396,667 | 3,142,342 | 463,124 | ||||||
| Statutory reserves | 1,260,923 | 1,260,923 | 185,837 | ||||||
| Accumulated other comprehensive income | (27,597 | ) | (27,342 | ) | (4,030 | ) | |||
| Retained earnings | 7,816,234 | 7,894,918 | 1,163,567 | ||||||
| Total shareholders’ equity | 11,952,631 | 12,001,216 | 1,768,762 | ||||||
| TOTAL LIABILITIES AND SHAREHOLDERS’ EQUITY | 23,162,963 | 22,382,082 | 3,298,712 | ||||||
__________________________
(1) Short-term financing receivables, net of allowance for credit losses of
Short-term contract assets and receivables, net of allowance for credit losses of
Long-term financing receivables, net of allowance for credit losses of
Long-term contract assets and receivables, net of allowance for credit losses of
Unaudited Condensed Consolidated Statements of Operations |
|||||||||||||||||||
| For the Three Months Ended |
For the Six Months Ended |
||||||||||||||||||
| (In thousands, except for share and per share data) | 2025 | 2026 | 2025 | 2026 | |||||||||||||||
| RMB | RMB | US$ | RMB | RMB | US$ | ||||||||||||||
| Operating revenue: | |||||||||||||||||||
| Credit facilitation service income | 2,269,846 | 1,930,271 | 284,487 | 4,460,712 | 4,161,942 | 613,394 | |||||||||||||
| Loan facilitation and servicing fees-credit oriented | 1,130,734 | 738,377 | 108,823 | 2,266,963 | 1,776,306 | 261,795 | |||||||||||||
| Guarantee income | 571,181 | 758,525 | 111,793 | 1,118,995 | 1,485,601 | 218,950 | |||||||||||||
| Financing income | 567,931 | 433,369 | 63,871 | 1,074,754 | 900,035 | 132,649 | |||||||||||||
| Tech-empowerment service income | 830,124 | 473,053 | 69,719 | 1,454,974 | 1,025,853 | 151,192 | |||||||||||||
| Installment e-commerce platform service income | 487,444 | 783,684 | 115,501 | 775,827 | 1,308,351 | 192,827 | |||||||||||||
| Total operating revenue | 3,587,414 | 3,187,008 | 469,707 | 6,691,513 | 6,496,146 | 957,413 | |||||||||||||
| Operating cost | |||||||||||||||||||
| Cost of sales | (425,900 | ) | (484,419 | ) | (71,395 | ) | (687,932 | ) | (833,118 | ) | (122,786 | ) | |||||||
| Funding cost | (59,940 | ) | (24,504 | ) | (3,611 | ) | (142,944 | ) | (80,146 | ) | (11,812 | ) | |||||||
| Processing and servicing cost | (605,652 | ) | (546,287 | ) | (80,513 | ) | (1,156,793 | ) | (1,180,137 | ) | (173,931 | ) | |||||||
| Provision for financing receivables | (256,857 | ) | (410,100 | ) | (60,441 | ) | (439,006 | ) | (750,760 | ) | (110,648 | ) | |||||||
| Provision for contract assets and receivables | (164,224 | ) | (173,689 | ) | (25,599 | ) | (293,909 | ) | (310,198 | ) | (45,718 | ) | |||||||
| Provision for contingent guarantee liabilities | (802,157 | ) | (1,052,289 | ) | (155,088 | ) | (1,479,337 | ) | (2,011,441 | ) | (296,450 | ) | |||||||
| Total operating cost | (2,314,730 | ) | (2,691,288 | ) | (396,647 | ) | (4,199,921 | ) | (5,165,800 | ) | (761,345 | ) | |||||||
| Gross profit | 1,272,684 | 495,720 | 73,060 | 2,491,592 | 1,330,346 | 196,068 | |||||||||||||
| Operating expenses: | |||||||||||||||||||
| Sales and marketing expenses | (567,025 | ) | (346,996 | ) | (51,141 | ) | (1,060,153 | ) | (858,952 | ) | (126,594 | ) | |||||||
| Research and development expenses | (157,680 | ) | (146,681 | ) | (21,618 | ) | (313,306 | ) | (294,973 | ) | (43,474 | ) | |||||||
| General and administrative expenses | (96,010 | ) | (107,320 | ) | (15,817 | ) | (196,763 | ) | (204,825 | ) | (30,187 | ) | |||||||
| Total operating expenses | (820,715 | ) | (600,997 | ) | (88,576 | ) | (1,570,222 | ) | (1,358,750 | ) | (200,255 | ) | |||||||
| Change in fair value of financial guarantee derivatives and loans at fair value | 184,089 | 238,381 | 35,133 | 258,728 | 399,600 | 58,894 | |||||||||||||
| Interest expense, net | (4,621 | ) | (6,395 | ) | (943 | ) | (9,323 | ) | (11,703 | ) | (1,725 | ) | |||||||
| Investment loss | (5,126 | ) | (4,138 | ) | (610 | ) | (16,825 | ) | (7,646 | ) | (1,127 | ) | |||||||
| Others, net | 4,997 | 32,211 | 4,747 | 8,829 | 72,341 | 10,662 | |||||||||||||
| Income before income tax expense | 631,308 | 154,782 | 22,811 | 1,162,779 | 424,188 | 62,517 | |||||||||||||
| Income tax expense | (119,907 | ) | (53,467 | ) | (7,880 | ) | (221,054 | ) | (121,433 | ) | (17,897 | ) | |||||||
| Net income | 511,401 | 101,315 | 14,931 | 941,725 | 302,755 | 44,620 | |||||||||||||
| Net income attributable to ordinary shareholders of the Company | 511,401 | 101,315 | 14,931 | 941,725 | 302,755 | 44,620 | |||||||||||||
| Net income per ordinary share attributable to ordinary shareholders of the Company | |||||||||||||||||||
| Basic | 1.50 | 0.31 | 0.05 | 2.78 | 0.91 | 0.13 | |||||||||||||
| Diluted | 1.43 | 0.30 | 0.04 | 2.62 | 0.90 | 0.13 | |||||||||||||
| Net income per ADS attributable to ordinary shareholders of the Company | |||||||||||||||||||
| Basic | 3.00 | 0.61 | 0.09 | 5.55 | 1.83 | 0.27 | |||||||||||||
| Diluted | 2.85 | 0.61 | 0.09 | 5.25 | 1.81 | 0.27 | |||||||||||||
| Weighted average ordinary shares outstanding | |||||||||||||||||||
| Basic | 340,489,447 | 330,298,998 | 330,298,998 | 339,288,258 | 330,946,369 | 330,946,369 | |||||||||||||
| Diluted | 358,475,575 | 333,417,483 | 333,417,483 | 359,067,911 | 335,031,820 | 335,031,820 | |||||||||||||
Unaudited Condensed Consolidated Statements of Comprehensive Income |
|||||||||||||||||||
| For the Three Months Ended |
For the Six Months Ended |
||||||||||||||||||
| (In thousands) | 2025 | 2026 | 2025 | 2026 | |||||||||||||||
| RMB | RMB | US$ | RMB | RMB | US$ | ||||||||||||||
| Net income | 511,401 | 101,315 | 14,931 | 941,725 | 302,755 | 44,620 | |||||||||||||
| Other comprehensive income | |||||||||||||||||||
| Foreign currency translation adjustment, net of nil tax | 7,695 | (2,707 | ) | (399 | ) | 5,436 | 255 | 38 | |||||||||||
| Total comprehensive income | 519,096 | 98,608 | 14,532 | 947,161 | 303,010 | 44,658 | |||||||||||||
| Total comprehensive income attributable to ordinary shareholders of the Company | 519,096 | 98,608 | 14,532 | 947,161 | 303,010 | 44,658 | |||||||||||||
Unaudited Reconciliations of GAAP and Non-GAAP Results |
|||||||||||||||||||
| For the Three Months Ended |
For the Six Months Ended |
||||||||||||||||||
| (In thousands, except for share and per share data) | 2025 | 2026 | 2025 | 2026 | |||||||||||||||
| RMB | RMB | US$ | RMB | RMB | US$ | ||||||||||||||
| Reconciliation of Adjusted net income attributable to ordinary shareholders of the Company to Net income attributable to ordinary shareholders of the Company | |||||||||||||||||||
| Net income attributable to ordinary shareholders of the Company | 511,401 | 101,315 | 14,931 | 941,725 | 302,755 | 44,620 | |||||||||||||
| Add: Share-based compensation expenses | 24,183 | 22,022 | 3,246 | 53,724 | 45,128 | 6,651 | |||||||||||||
| Investment loss | 5,126 | 4,138 | 610 | 16,825 | 7,646 | 1,127 | |||||||||||||
| Adjusted net income attributable to ordinary shareholders of the Company | 540,710 | 127,475 | 18,787 | 1,012,274 | 355,529 | 52,398 | |||||||||||||
| Adjusted net income per ordinary share attributable to ordinary shareholders of the Company | |||||||||||||||||||
| Basic | 1.59 | 0.39 | 0.06 | 2.98 | 1.07 | 0.16 | |||||||||||||
| Diluted | 1.51 | 0.38 | 0.06 | 2.82 | 1.06 | 0.16 | |||||||||||||
| Adjusted net income per ADS attributable to ordinary shareholders of the Company | |||||||||||||||||||
| Basic | 3.18 | 0.77 | 0.11 | 5.97 | 2.15 | 0.32 | |||||||||||||
| Diluted | 3.02 | 0.76 | 0.11 | 5.64 | 2.12 | 0.31 | |||||||||||||
| Weighted average shares used in calculating net income per ordinary share for non-GAAP EPS | |||||||||||||||||||
| Basic | 340,489,447 | 330,298,998 | 330,298,998 | 339,288,258 | 330,946,369 | 330,946,369 | |||||||||||||
| Diluted | 358,475,575 | 333,417,483 | 333,417,483 | 359,067,911 | 335,031,820 | 335,031,820 | |||||||||||||
| Reconciliations of Non-GAAP EBIT to Net income | |||||||||||||||||||
| Net income | 511,401 | 101,315 | 14,931 | 941,725 | 302,755 | 44,620 | |||||||||||||
| Add: Income tax expense | 119,907 | 53,467 | 7,880 | 221,054 | 121,433 | 17,897 | |||||||||||||
| Share-based compensation expenses | 24,183 | 22,022 | 3,246 | 53,724 | 45,128 | 6,651 | |||||||||||||
| Interest expense, net | 4,621 | 6,395 | 943 | 9,323 | 11,703 | 1,725 | |||||||||||||
| Investment loss | 5,126 | 4,138 | 610 | 16,825 | 7,646 | 1,127 | |||||||||||||
| Non-GAAP EBIT | 665,238 | 187,337 | 27,610 | 1,242,651 | 488,665 | 72,020 | |||||||||||||
Additional Credit Information
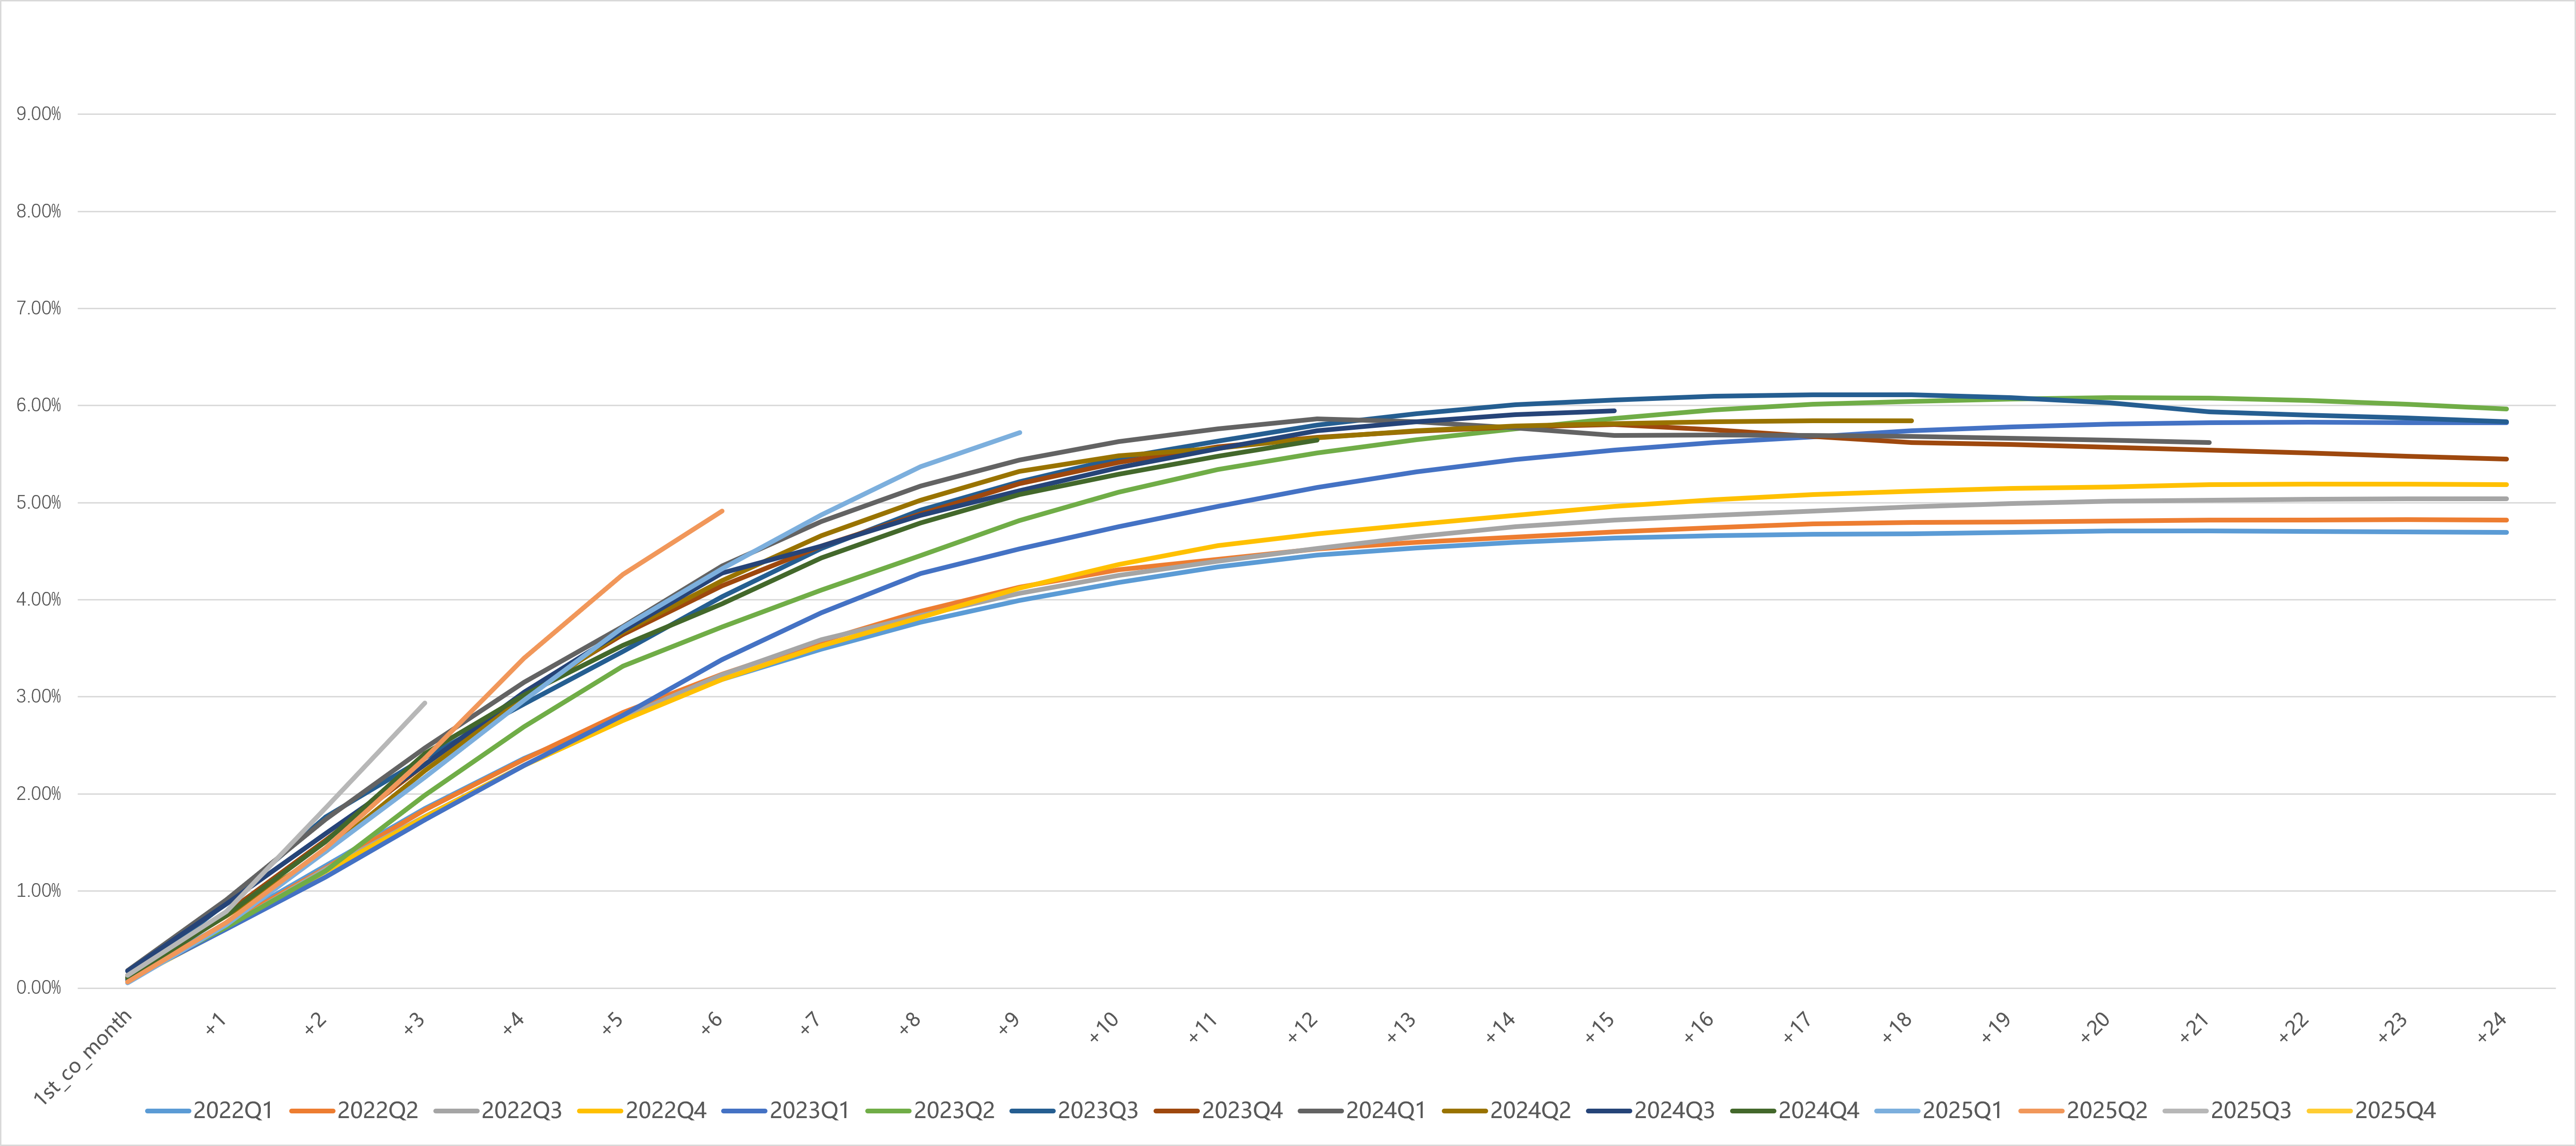
Vintage Charge Off Curve1
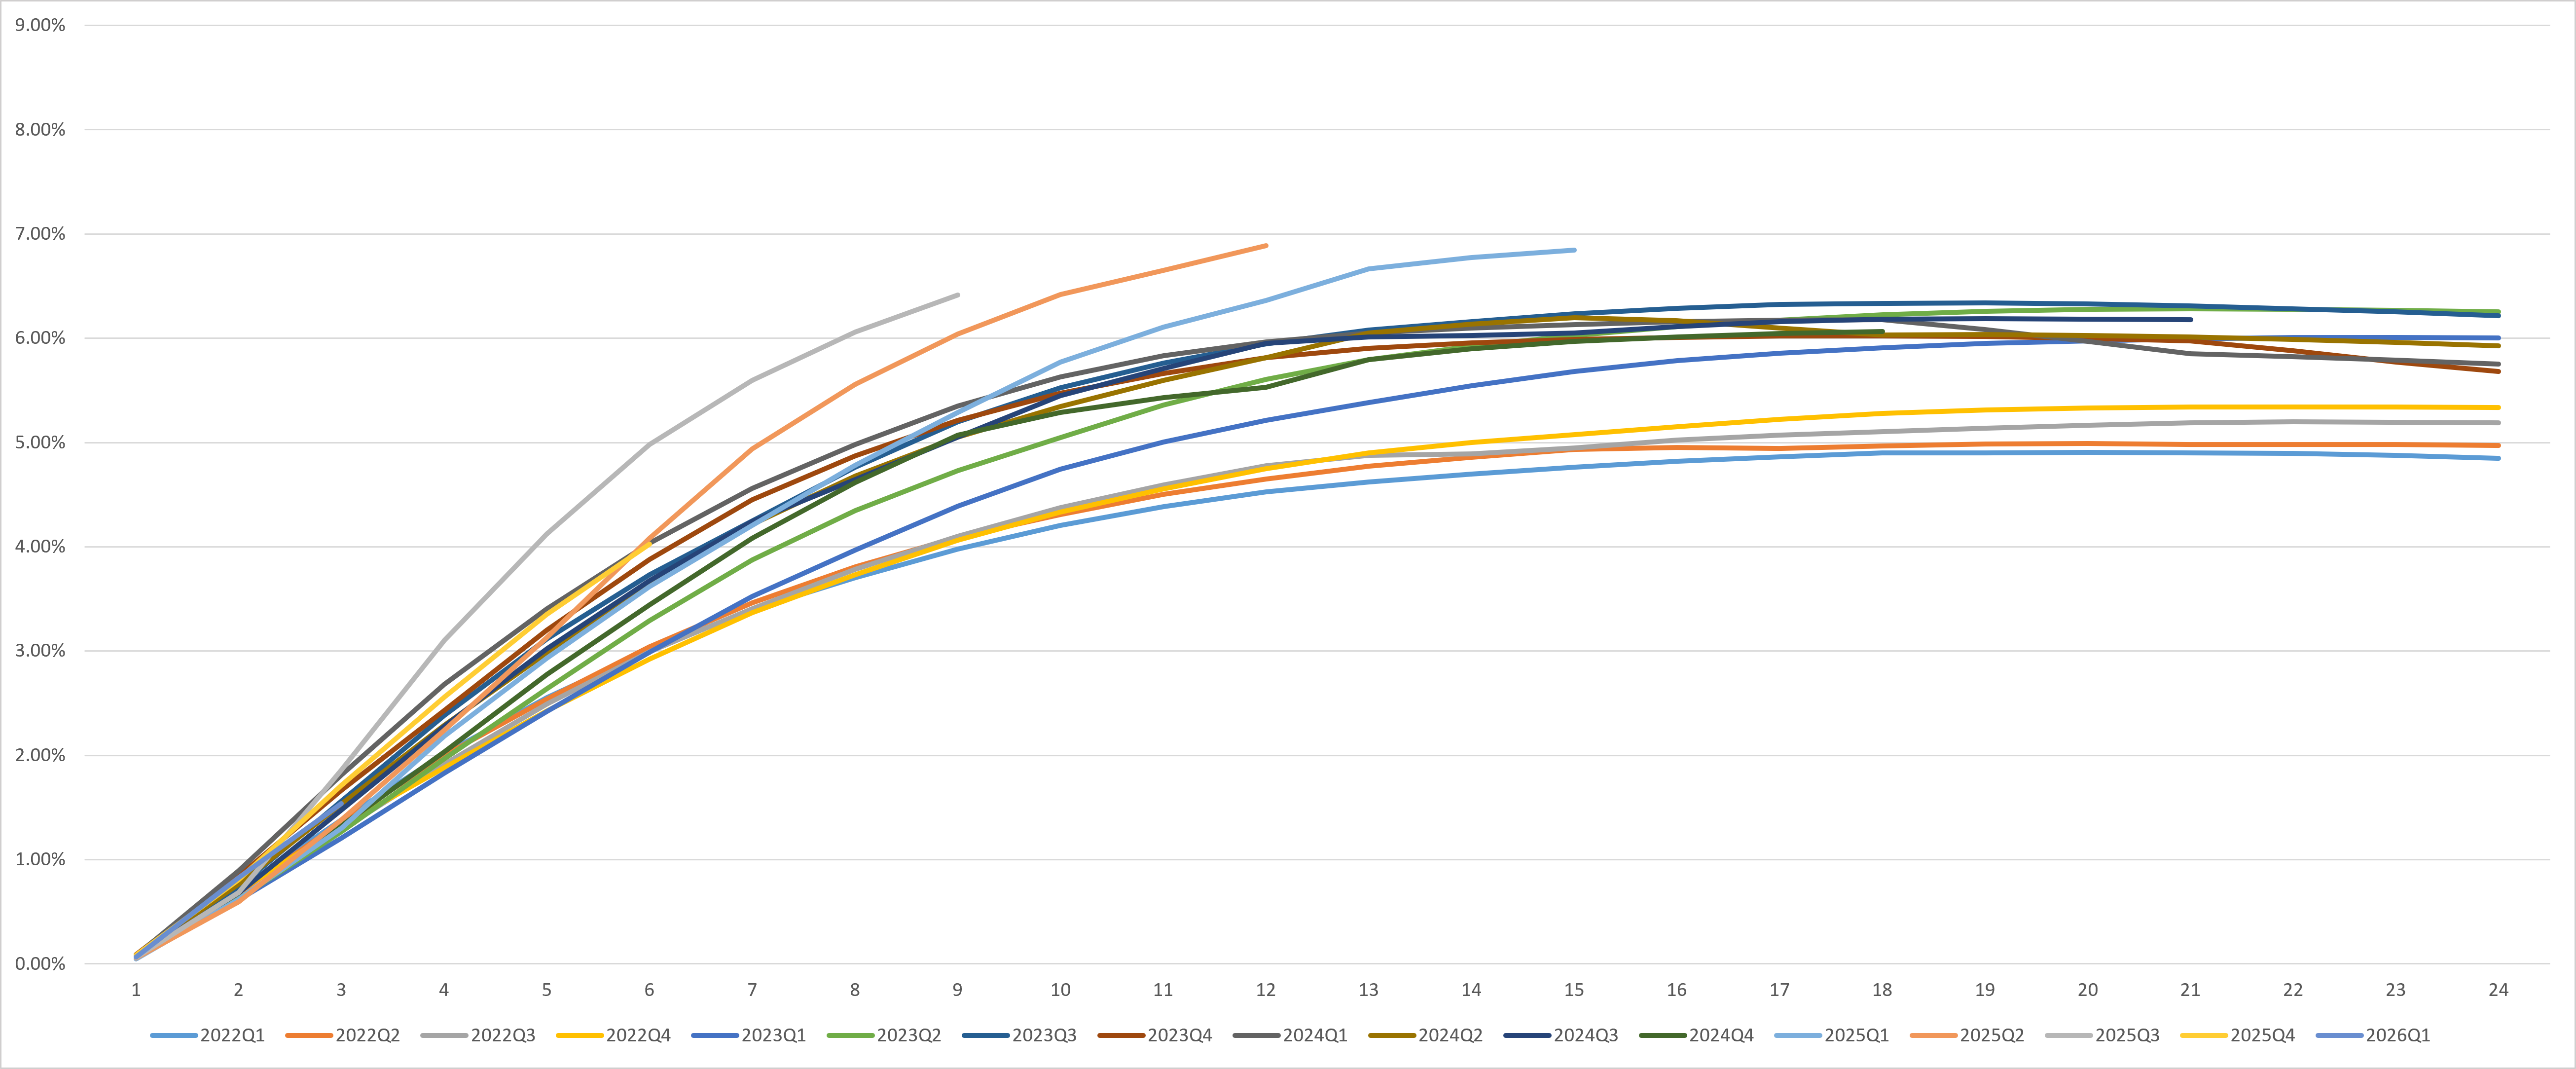
Dpd30+/GMV by Performance Windows1
First Payment Default 30+1
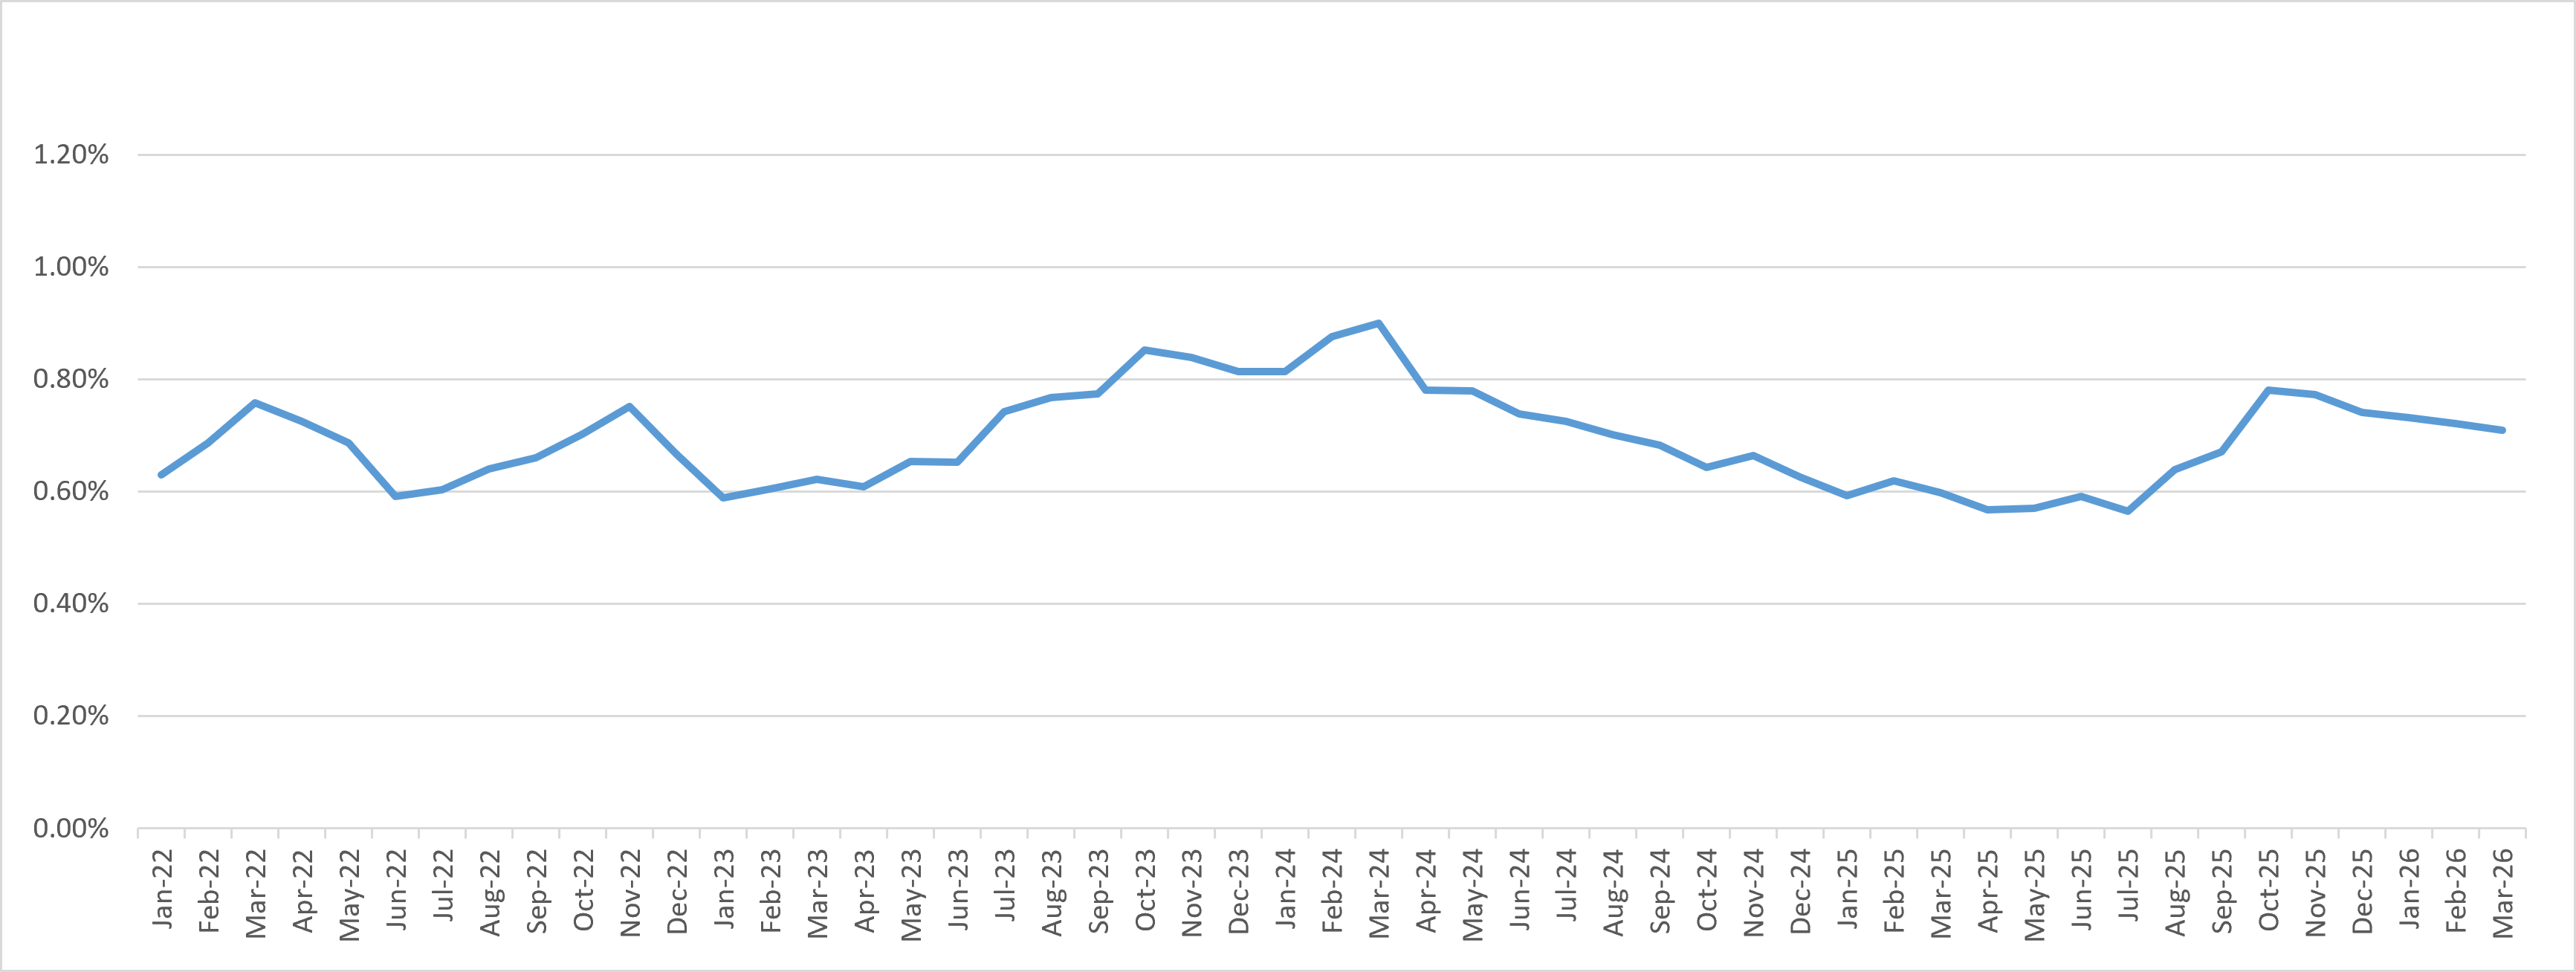
1. Loans facilitated under ICP and E-commerce business are excluded from the charts.


Vintage Charge Off Curve¹
Vintage Charge Off Curve¹
Dpd30+/GMV by Performance Windows¹
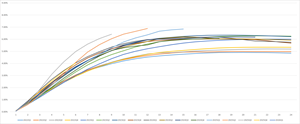
Dpd30+/GMV by Performance Windows¹
First Payment Default 30+¹
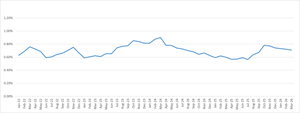
First Payment Default 30+¹
Source: LexinFintech Holdings Ltd.